Dashboard
The Security Dashboard provides a real-time view of your organization's security posture across every repository and pull request DryRun Security monitors, with overview metrics and trend charts scoped to a configurable time window.
Overview #
The Security Dashboard provides a real-time view of your organization's security posture across every repository and pull request DryRun Security monitors. All metrics are scoped to a configurable time window - 24 hours, 7 days, 30 days, or 90 days - so security and engineering teams can evaluate both current state and longer-term trends.
Overview Metrics #
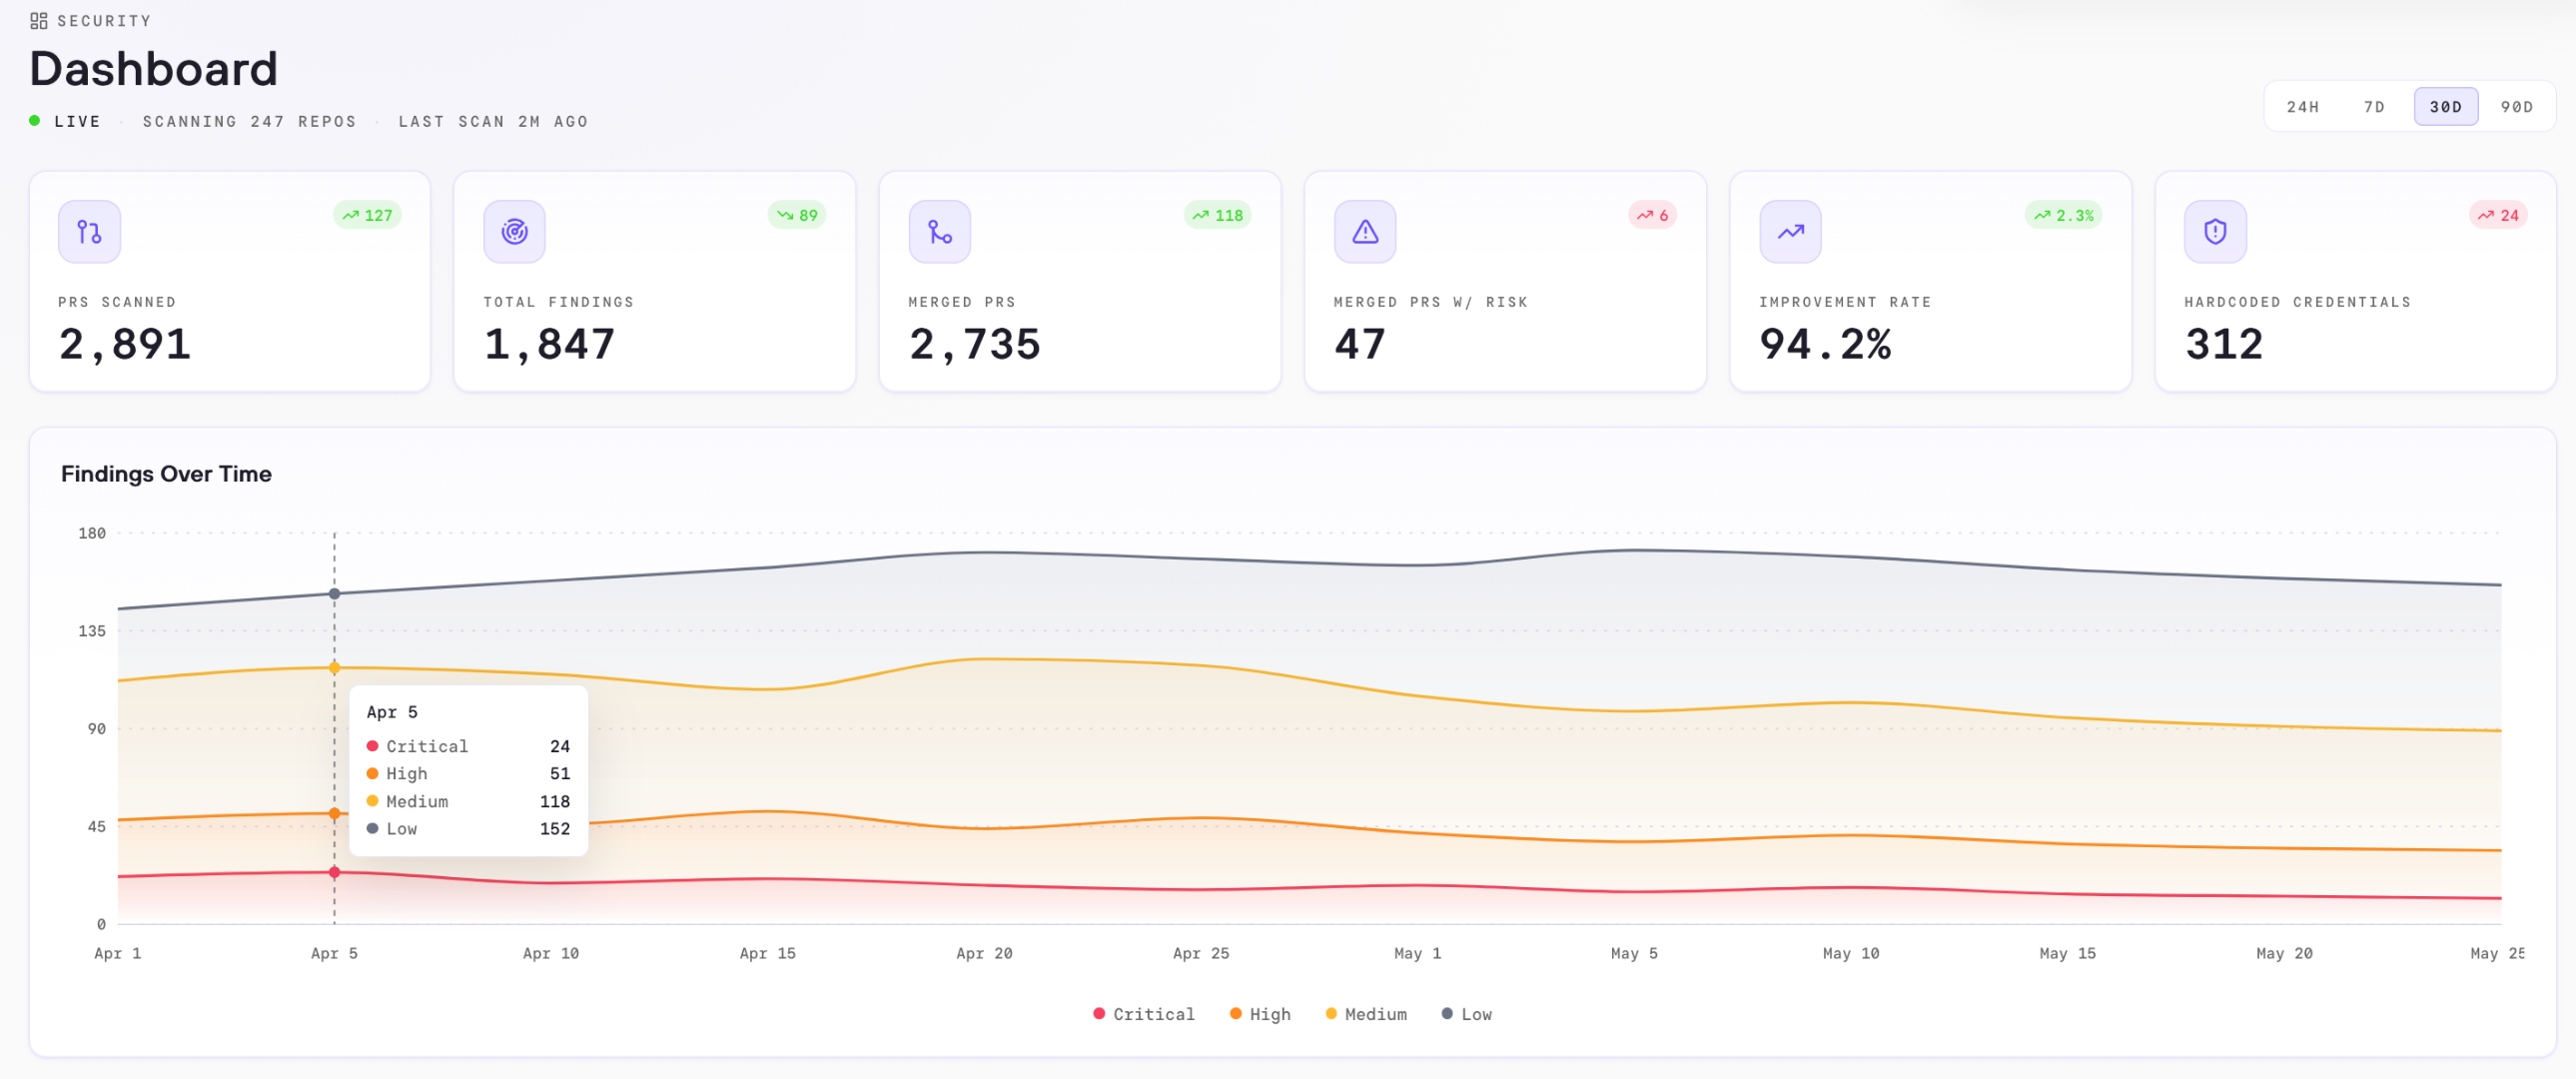
Six summary tiles appear across the top of the dashboard, giving an at-a-glance picture of activity and risk across the selected period.
PRs Scanned #
The total number of pull requests DryRun Security analyzed in the selected window. This is your coverage signal - every PR that entered review was evaluated for security issues across the repositories connected to your account.
Total Findings #
The cumulative number of security findings identified across all scanned PRs during the period. This represents the full volume of security signals your team is working through, spanning all severity levels and vulnerability classes.
Merged PRs #
The total number of PRs merged during the period. Read alongside PRs Scanned and Merged PRs w/ Risk, this provides a clear picture of code velocity relative to security outcomes.
Merged PRs w/ Risk #
PRs authored by a developer and merged while carrying at least one unresolved finding. This is a direct measure of residual risk entering your codebase. A low count relative to total merged PRs indicates your team is consistently resolving findings before code ships.
Improvement Rate #
The percentage of scanned PRs flagged as improved during the selected period. A PR is considered improved when a finding identified in one scan is no longer present in the next scan of that same PR - meaning the developer addressed it within the review cycle, before merge. A high improvement rate indicates findings are being caught and fixed at the point of introduction rather than carried forward.
Hardcoded Credentials #
A dedicated count of credential-related findings - API keys, tokens, secrets, and similar sensitive values - across all scanned PRs. Hardcoded credentials represent one of the highest-impact risks in any codebase and are surfaced separately so they remain visible regardless of overall finding volume.
Charts #
Findings Over Time #
A stacked line chart tracking findings at each severity level - Critical, High, Medium, and Low - across the selected time window. Each line moves independently, so you can see whether risk is shifting between severity tiers over time, not just whether the total is going up or down.
Findings by Repository #
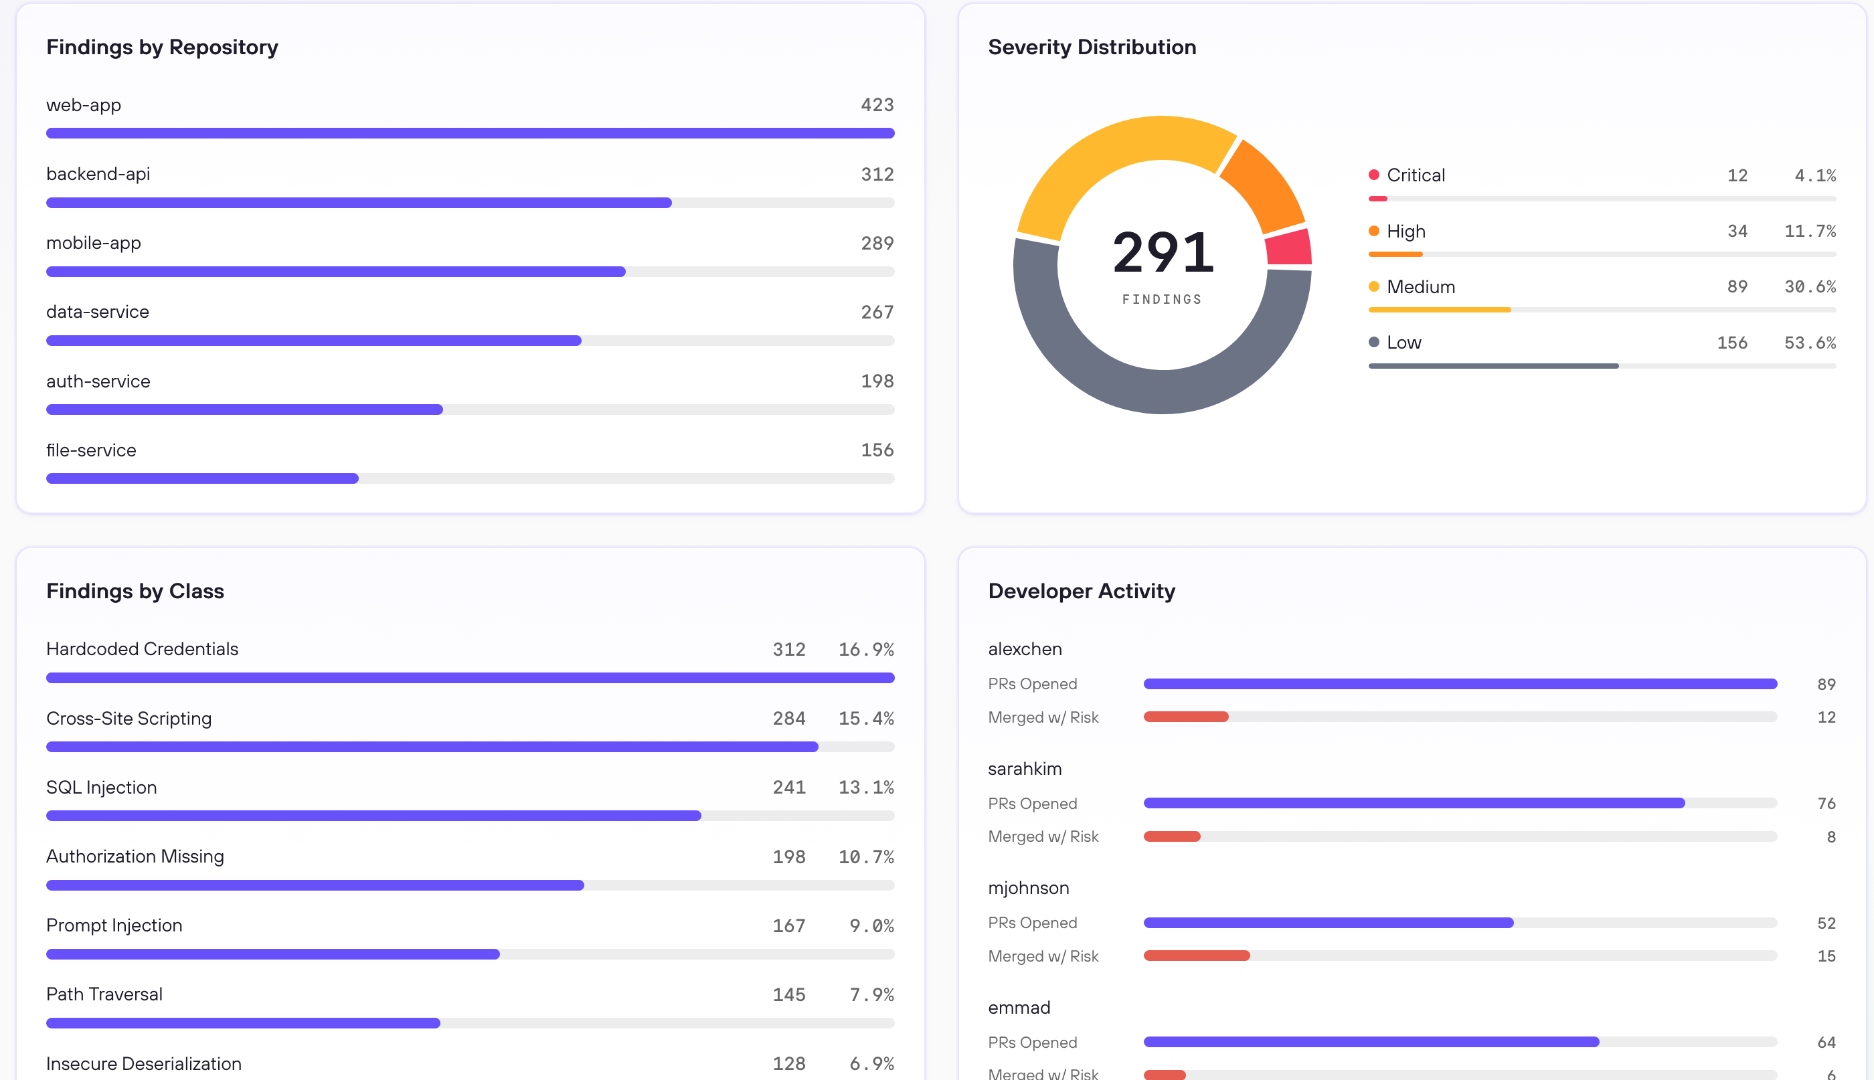
A ranked view of which repositories are generating the most findings. This helps security and platform teams understand where risk is concentrated and prioritize remediation effort across the portfolio.
Severity Distribution #
A breakdown of active findings by severity - Critical, High, Medium, and Low - with a count and percentage for each tier. The center of the chart shows the total. Use this to assess whether your open risk is weighted toward high-severity issues that need immediate attention or spread across lower-severity findings.
Findings by Class #
A ranked breakdown by vulnerability type - such as Hardcoded Credentials, Cross-Site Scripting, SQL Injection, and others. Recurring patterns within a class often point to a shared dependency, an architectural pattern, or a training gap, making this view useful for identifying systemic issues beyond individual findings.
Developer Activity #
A per-developer breakdown showing PRs opened and the subset of those PRs merged with at least one unresolved finding. This view helps AppSec and engineering leads understand how security habits are distributed across the team and where additional guidance may be needed.